I’m interested in local government finance mostly because of my interest in participatory budgeting (PB), especially £EITH CHOOSES. This leads to the question ‘where does PB money come from?‘ I’m also interested in how Scottish local government will ‘mainstream’ PB, leading me to consider ‘what budgets will be opened up to citizen input?‘, ‘how will this be done?‘, ‘how will citizen-control be squared with statutory requirements?‘.
On a personal level, I’m curious about how Edinburgh Council (CEC) decides how to spend its (our!) money, not least because it needs to make massive savings in 2019-20 onwards. I’m concerned about the effects this will have on me, on my adopted home city and above all, the many people who absolutely need government services and benefits. So I jumped at the chance to take part in a budget group challenge last Thursday.
The challenge was based on 18 areas (see the table below) where CEC spends more than £3 million each year. These areas are also in CEC’s online budget simulator, where they are grouped into three themes:
- communities and families
- health and social care
- place.
Cards for each of these areas used 127 dark green squares to indicate proportionately how much CEC spends on these area each year.
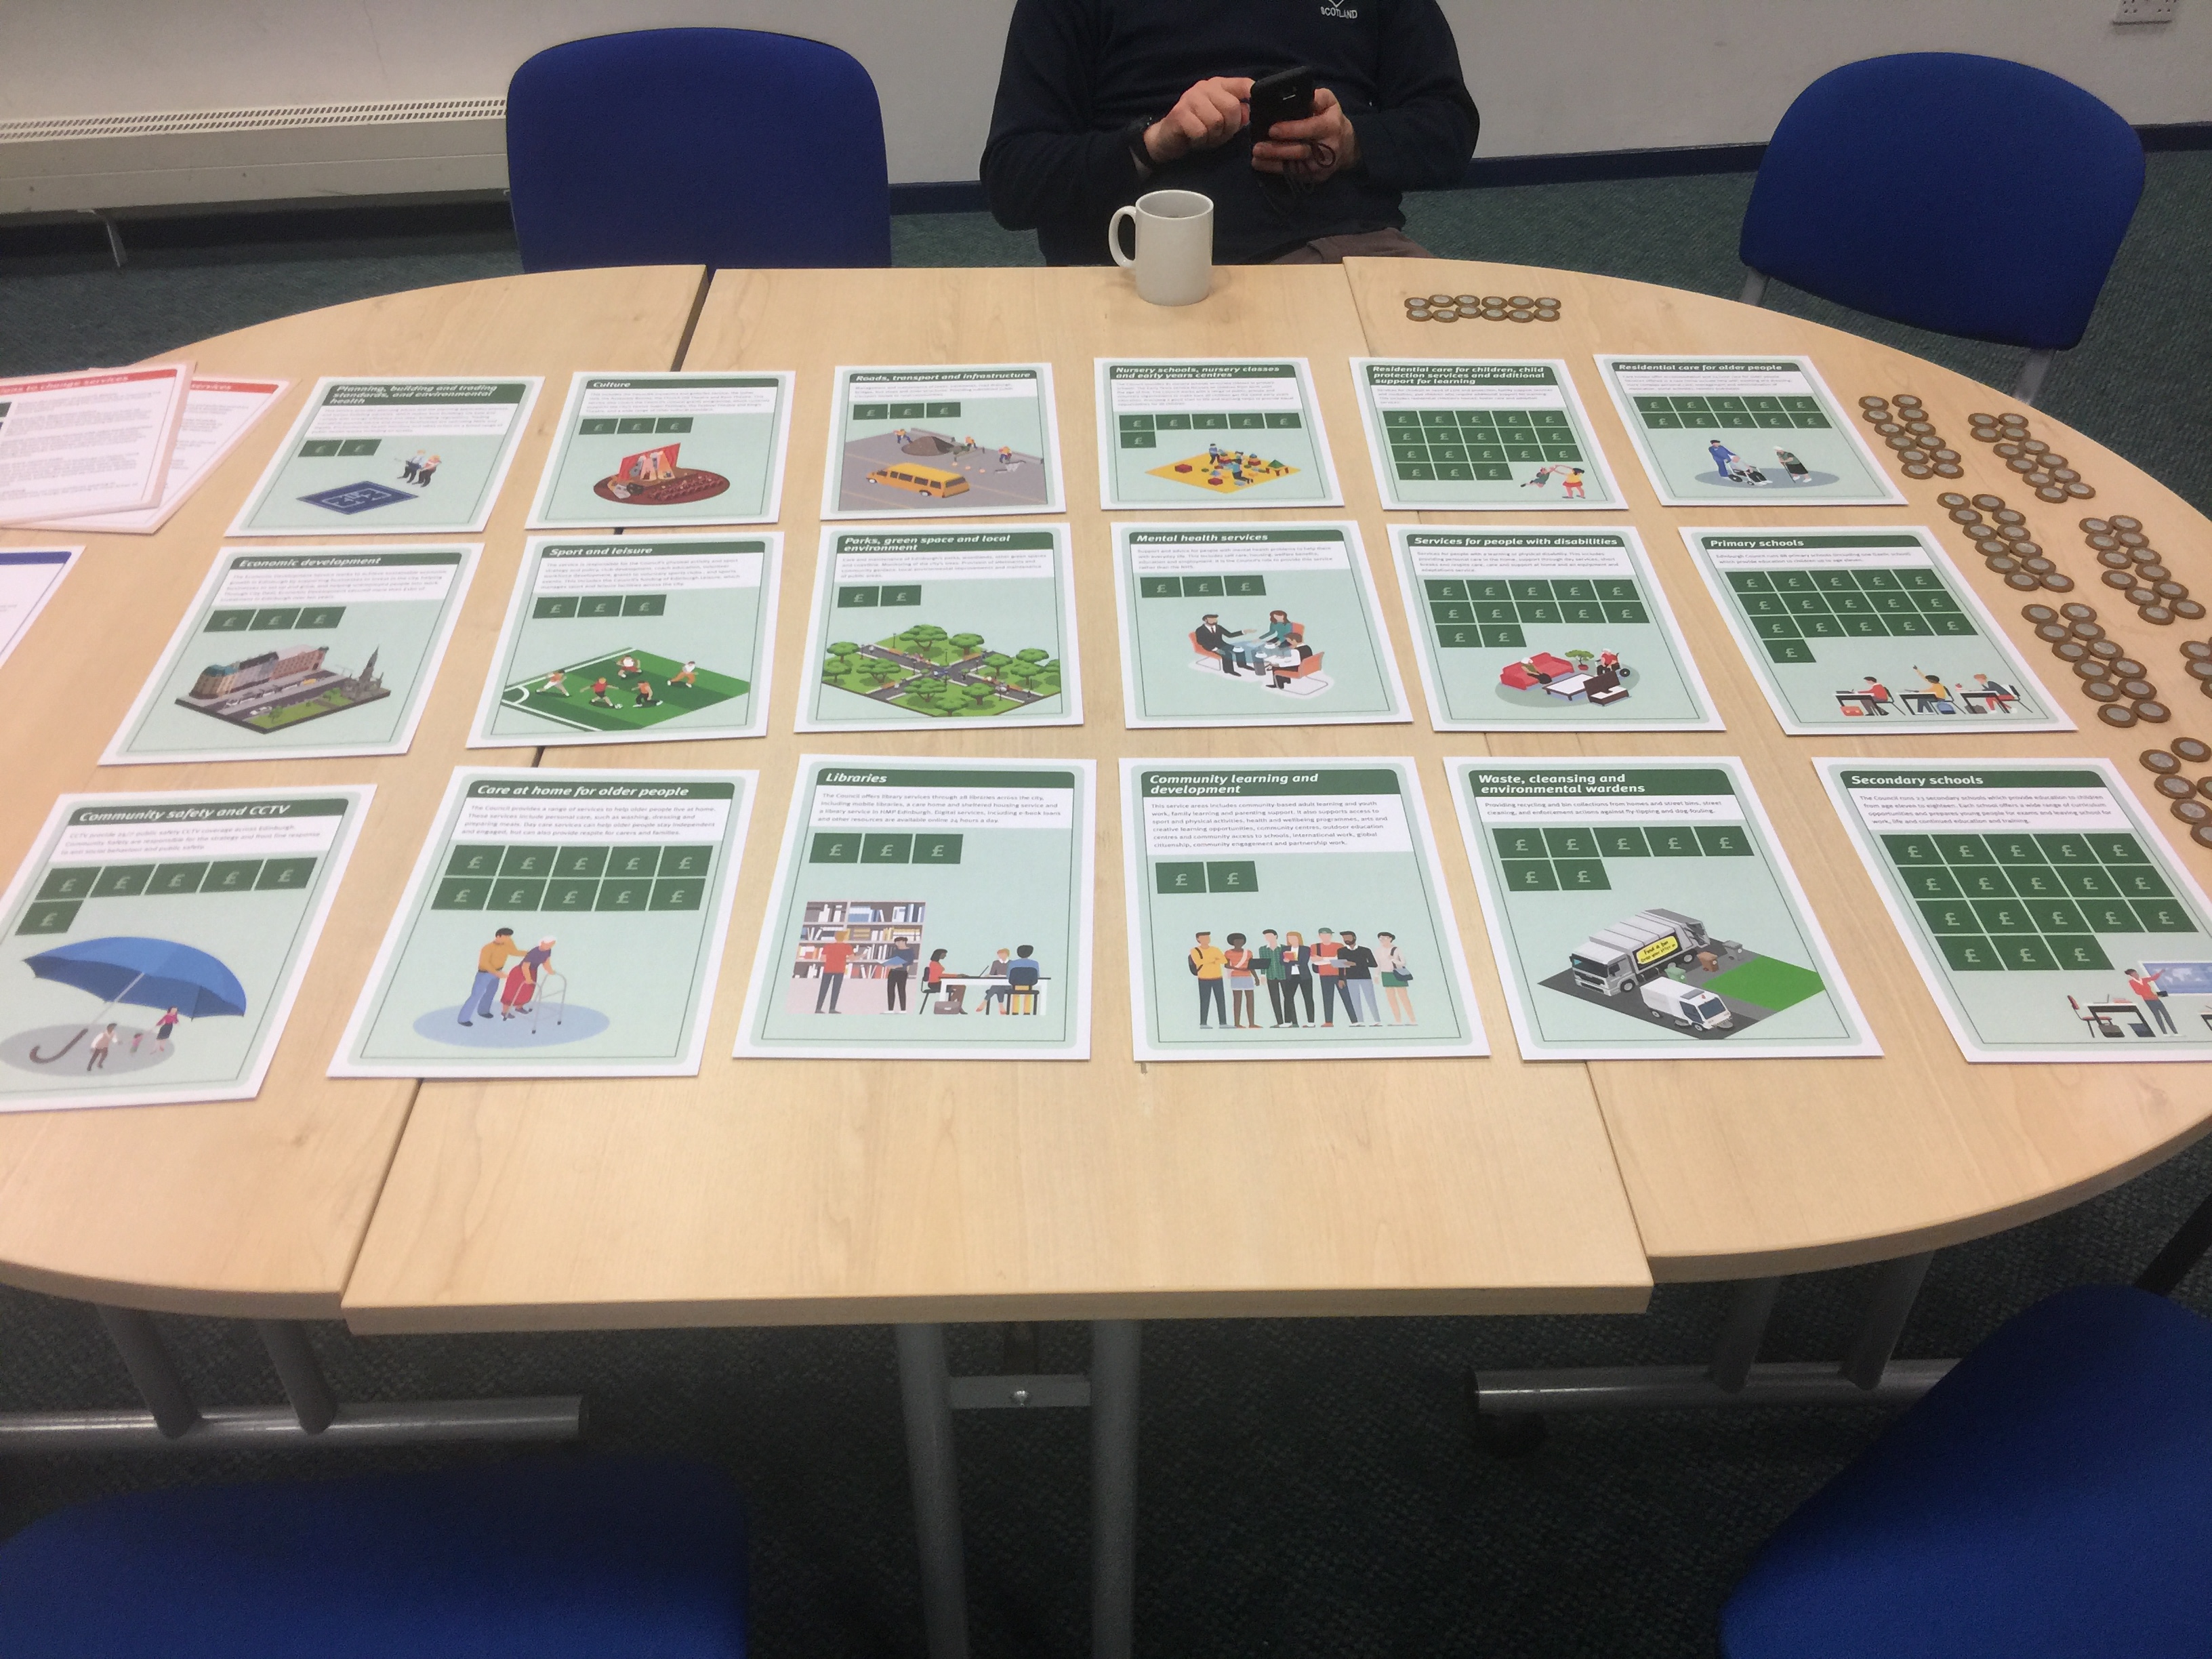
Budget group challenge cards (Click the photo to see a full-size version.)
Each participant (6 community councillors, a CEC councillor and me) were given 12 ‘coins’ to ‘spend’ on the 18 areas, by making our own individual choices. If all of an area’s squares received ‘coins’, it would receive a slight spending increase in our ‘2019-2020 budget’. If all but one squares were covered, that would receive the same amount as in 2018-19. Anything less implied a budget cut. (The effects of these cuts are outlined in the online budget simulator.) Giving an area more ‘coins’ than it had squares was not allowed.
First draft budget
Between us, we should have had 96 ‘coins’, we should have had a shortfall of 31 ‘coins’, or just under a quarter of the 2018-19 budget. (According to my photos, we had 98 ‘coins’.) Once we had all placed our ‘coins’ and discussed changes, our results were:
| Themes and areas | squares covered | squares available | shortfall | meaning |
| Communities and families | ||||
| Nursery schools, nursery classes and early years centres | 5 | 6 | 1 | unchanged |
| Primary schools | 13 | 16 | 3 | cut |
| Secondary schools | 13 | 18 | 5 | cut |
| Residential care for children, child protection services and additional support for learning | 10 | 18 | 8 | cut |
| Library Services | 3 | 3 | 0 | increase |
| Community Safety and CCTV | 3 | 6 | 3 | cut |
| Sport and leisure | 3 | 3 | 0 | increase |
| Community Learning and Development | 1 | 2 | 1 | unchanged |
| Health and social care | ||||
| Residential care for older people | 8 | 10 | 2 | cut |
| Care at home for older people | 8 | 10 | 2 | cut |
| Services for people with disabilities | 8 | 12 | 4 | cut |
| Mental Health Services | 3 | 3 | 0 | increase |
| Place | ||||
| Waste, cleansing and environmental wardens | 7 | 7 | 0 | increase |
| Roads, transport and infrastructure | 3 | 3 | 0 | increase |
| Economic Development | 3 | 3 | 0 | increase |
| Culture | 3 | 3 | 0 | increase |
| Parks, Greenspace and Local Environment | 2 | 2 | 0 | increase |
| Planning, Building & Trading Standards and Environmental Health | 2 | 2 | 0 | increase |
| Totals | 98 | 127 | 29 | cut |
This result provoked some comment, and an attempt by me to increase the overall budget by putting a 20p piece onto a vacant ‘care at home for older people’ square. (This ‘external philanthropy’ was ruled out of order.) Most of the comments revolved around how combining services might help. For example, it was suggested that Libraries and Schools could be combined, so that more books and other library services were available to pupils and parents simultaneously. One of the participants stated that libraries are a 19th century solution to an 18th century problem. The CEC officials confirmed that CEC had a statutory duty to provide library services, but that they did not need to be provided in the ways currently in use.
Options for change
The CEC officials running the group next introduced 10 options which might result in savings that could be allocated among the 18 areas. However, each one would only go ahead if we unanimously agreed with it. Here’s our results:
| Option for change | Saving agreed unanimously? |
| Reduce the number of Council depots | yes |
| Create a city operations centre | yes |
| Combine non-statutory services with other local authorities | yes |
| Create more service hubs | no |
| Review parking | no |
| Review the cultural estate | yes |
| More fees charged for commercial use of parks | no |
| More revenue from advertising | no |
| Generate energy | yes |
| Introduce a workplace parking levy | no |
I thought that ‘reduce the number of Council depots’ and ‘create more service hubs’ were potentially contradictory, in that the first would sell off some probably tatty buildings while the second would need new, decent buildings to be bought or rented. Also, several participants suggested that the savings would depend on the numbers of journeys saved, and on whether buildings could be bought or sold at the presumed savings.
Similarly, for me, ‘review’ means only ‘find out what exists’, and does not guarantee savings. What if a review suggests that more spending is needed, e.g. to prevent the City Chambers from falling down? (Any organisation with old buildings will face that sooner or later.)
At least two ‘no’ votes came from a single participant who claimed that Edinburgh has a certain relationship with cars that is not going to change, at least not in the timeframe of the exercise. Three participants were cycling lobbyists (disclosure – I was one of them) but we were not able to dissuade him. I find that annoying: while I can understand cars might be convenient as ‘mummy’s taxi’, possibly for the weekly shop, or to travel out of Edinburgh (I have a friend who commutes most days to St Andrews), I don’t think they are needed for most commuting within Edinburgh. Having cycled to school since I was 6 in a medium-sized city, I deplore driving children to school. I’ve seen people give up cars in Edinburgh.
Eventually, our 5 savings gave us 5 ‘coins’ to add to the 18 areas. We were also allowed to move some of our original ‘coins’ so our final result was:
| Themes and areas | squares covered | squares available | shortfall | meaning | change |
| Communities and families | |||||
| Nursery schools, nursery classes and early years centres | 6 | 6 | 0 | increase | 1 |
| Primary schools | 13 | 16 | 3 | cut | 0 |
| Secondary schools | 14 | 18 | 4 | cut | 1 |
| Residential care for children, child protection services and additional support for learning | 14 | 18 | 4 | cut | 4 |
| Library Services | 3 | 3 | 0 | increase | 0 |
| Community Safety and CCTV | 3 | 6 | 3 | cut | 0 |
| Sport and leisure | 3 | 3 | 0 | increase | 0 |
| Community Learning and Development | 1 | 2 | 1 | unchanged | 0 |
| Health and social care | |||||
| Residential care for older people | 8 | 10 | 2 | cut | 0 |
| Care at home for older people | 8 | 10 | 2 | cut | 0 |
| Services for people with disabilities | 9 | 12 | 3 | cut | 1 |
| Mental Health Services | 3 | 3 | 0 | increase | 0 |
| Place | |||||
| Waste, cleansing and environmental wardens | 7 | 7 | 0 | increase | 0 |
| Roads, transport and infrastructure | 3 | 3 | 0 | increase | 0 |
| Economic Development | 3 | 3 | 0 | increase | 0 |
| Culture | 2 | 3 | 1 | unchanged | -1 |
| Parks, Greenspace and Local Environment | 2 | 2 | 0 | increase | 0 |
| Planning, Building & Trading Standards and Environmental Health | 1 | 2 | 1 | unchanged | -1 |
| Totals | 103 | 127 | 24 | cut | |
perhaps the most interesting part of this is what we changed. We boosted Nursery schools, nursery classes and early years centres (so this now gets a slight budget increase); Secondary schools (but this still has a budget cut); Residential care for children, child protection services and additional support for learning (but this still has a budget cut); Services for people with disabilities (but this still has a budget cut). We took away from Culture ; and Parks, Greenspace and Local Environment, so both of these now have unchanged rather than increased budgets. The biggest boost was for Residential care etc (4 ‘coins’). The smallest cuts were only 1 ‘coin’ each.
So it appears we were happier to increase budgets than to cut them, which is probably not unusual. We probably all had slightly different interpretations of what the areas meant, so I’d like to see exactly what spending each covers, and to look for possible synchronicities and resulting savings. But the take-home lesson is that allocating a budget when there isn’t enough money to cover everything is hard!
